I don’t make many bold predictions. But nearly a decade ago I did just that in this article. I challenged the most popular monthly income mutual fund of the day, now known as IA Clarington Canadian Income (now called IA Clarington Strategic Income Fund Y). I stated that this balanced fund’s 10% distribution rate at the time could not be sustained and would have to be cut. No recommendation has ever caused me such grief. I received angry phone calls and e-mails. But I turned out to be right.
Fast forward to 2011. In today’s Globe & Mail I take readers through a process for testing whether an investment’s monthly cash payout can continue longer-term. It’s the same process I used to make my Clarington prediction in 2001. While Clarington and some other firms have adopted more flexible distribution policies, several funds continue to sport unsustainable cash payouts. And I use a popular big bank fund to illustrate our distribution sustainability test in today’s article.
There was not sufficient space in the paper to provide more specific guidance so below I detail where to find the bond yield data and distribution sustainability estimates on a few other popular funds.
Bond yield data
Some firms post yield-to-maturity (YTM) data for their bond portfolios. In the absence of such good public disclosure, you can use the asset mix of an income fund to estimate YTM. ETFs tracking various bond indices can be helpful to obtain timely YTM data. For instance, many iShares bond ETFs invest in bonds and they post YTM data daily. Similarly, the ETF websites of BMO and Claymore can also be helpful in this regard, depending on a fund’s bond exposure.
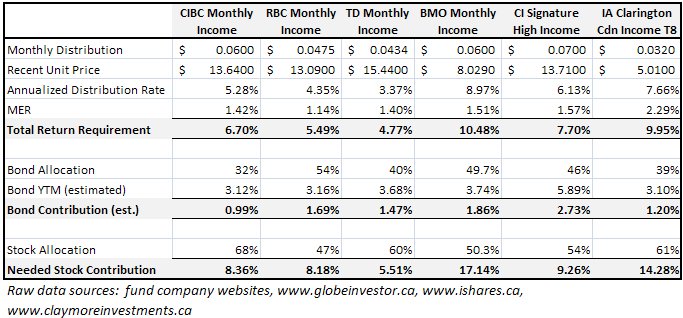
Distribution sustainability of selected funds
If the required return from stocks is under 10% (before fees), the distribution is probably safe. If it’s between 10% and 15% annually, the distribution is at risk. For a fund with a sky-high required return from stocks (i.e. 15% or more per year), I would say it’s simply a matter of time before distributions are cut. I recently applied the method detailed in the article to a handful of popular income funds. Click on the image below to enlarge the full table of calculations. If you spend your income fund’s distributions, you’d be wise to spend some time testing using the same process.