As a child, I sat too close to the TV, cracked my knuckles, and swallowed more than a few pieces of gum. If all of the legends I heard in childhood were true, I would now be a visually-impaired, middle-aged man with arthritis and tummy full of undigested gum. I cannot escape aging, but thankfully, those other things proved to be myths.
Life is full of myths and misconceptions – and the investing world is no exception. Covered call writing strategies are the subject of some of the most persistent investor misunderstandings. Promoters of covered calls writing strategies argue that the strategy excels in flat or range-bound markets.
The argument goes something like this: While selling call options gives away upside, the strategy’s premium cash flow should fuel outperformance in “flat” markets or periods when stock prices just plod along in a narrow range. This claim is best split into two parts – the nature of flat markets and performance during these periods.
When people speak of flat markets, they are referring to a meaningful time period – e.g., at least a few years – where stock markets end close to where they began. Such periods have historically been marked by steep declines followed by sharp recoveries. In other words, so-called flat markets are almost always very volatile.
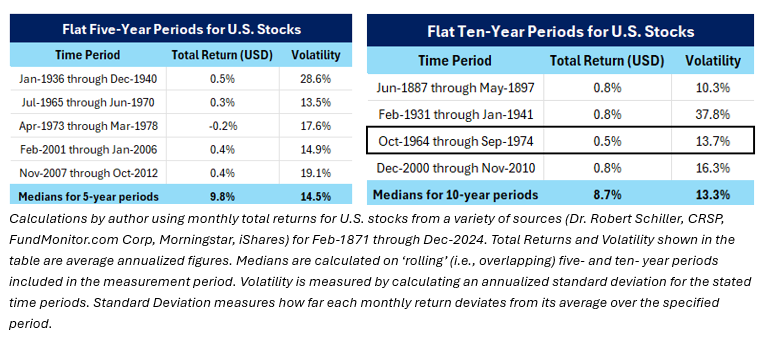
Using more than a century of U.S. stock market monthly total returns, I isolated flat market periods – which I defined as total returns ranging from -1% and +1% per year over five- or ten- year periods. The tables below summarize annualized total returns and volatility for the flat market periods identified.
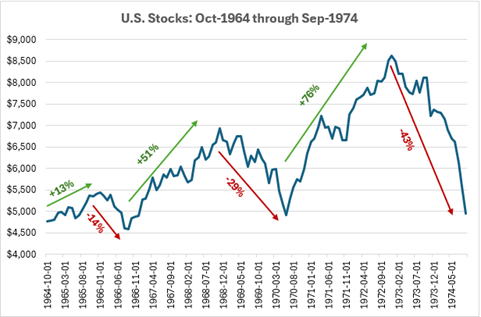
While flat markets can boast lower-than-usual volatility, seven of the nine time periods in the above tables experienced above-median volatility. The chart below breaks down one such period, which is one of the least volatile.
U.S. stock returns clocked in at just 0.5% per year for the decade ending on September 30, 1974. This period sported increasingly strong bull market runs, each followed by punishing declines – ending the period barely above the level from ten years earlier on a total return basis. From the table above, this flat market featured volatility close to the historical median for past overlapping 120-month periods. Virtually every other period in the above tables was more volatile than this. There is nothing flat about “flat markets” – but rather a series of wild up and down swings in market value.
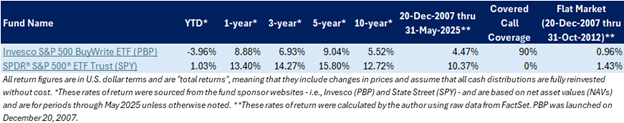
To address the question of performance, we examined the performance of two US-based exchange traded funds (ETFs). The Invesco S&P 500 BuyWrite ETF (PBP), launched in December 2007, buys the stocks in the S&P 500 Index and sells options on about ninety percent of its holdings. Its seventeen-year history includes one flat market period. I selected the SPDR S&P 500 ETF Trust (SPY) as its benchmark because it holds the same index stocks but without the covered call writing (or any other option strategy). The table below summarizes selected performance statistics for these two ETFs.
Invesco’s covered call ETF (PBP) has underperformed State Street’s SPY (a simple S&P 500 Index ETF) by a mile over more than seventeen years – by nearly six percentage points per year. During the period closest to the flat market identified in the first set of tables above, Invesco’s covered call ETF slightly lagged SPY’s pure stock exposure.
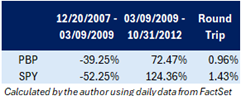
It was not all bad for PBP (the covered call ETF). From its inception through March 9, 2009, SPY’s pure stock exposure resulted in a 52% decline. The cash flow from PBP’s option selling meaningfully cushioned the loss, resulting in a 39% fall. I noted the downside protection in my May 2023 article on covered call strategies. But I also highlighted in that article that investors give up a lot of upside.
From March 9, 2009, through October 2012, PBP significantly lagged its simpler counterpart SPY. The upside that covered calls gave up was much larger than the downside cushion on the way down. The result: slight underperformance in what is supposed to be an ideal market environment for PBP and other similar funds. The table below summarizes these decline and recovery statistics.
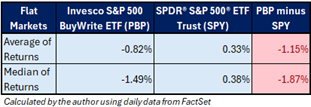
Since five- and ten- year periods are not the only meaningful time frames, I also looked at SPY’s total returns over one- to four- year periods using daily data to spot a greater number of flat markets. I found a dozen or so different time periods during which SPY was flat. PBP’s covered call strategy underperformed two-thirds of the time – with an average underperformance of more than 1% per year across all periods measured.
PBP stood out in one respect. The shorter the duration of the flat market period, the more likely it was to outperform pure stock market exposure. For example, while it outperformed in half of the flat one-year periods it outperformed overall by an average of 1% in these periods. Flat markets lasting two or more years saw PBP underperform virtually every time.
What of the claim that covered call strategies excel in flat markets? Unless you can accurately predict one-year periods with returns close to zero, this claim seems as likely as me having a belly full of gum from my childhood – just another urban legend.
Regardless of how you acquired your wealth, there’s one thing all investors have in common—a…
An architect wouldn’t design a custom home for a family without first asking many questions…
Financial planning is the first step in a comprehensive discovery phase at HighView Financial Group.…
A “fixed asset” is a long-term tangible asset that is not expected to be consumed…
One of the core principles at HighView is to understand the purpose of the portfolio.…