
 “Fund Facts” is a 2 to 4 page regulatory summary document designed to inform investors on a mutual fund’s salient features. A version for exchange-traded funds – i.e. ETF Facts – will be required starting next September. One of the most important aspects of Fund Facts and ETF Facts is its “how risky is it?” section. While the Canadian Securities Administrators (CSA) recently took the good step of creating a uniform standard, its risk rating method is unlikely to better inform or protect investors in my opinion.
Fund Facts and ETF Facts show risk on a five-point scale ranging from “low” to “high”. Product sponsors will calculate each fund’s standard deviation (SD) – which measures how widely a fund’s returns bounce around its monthly average – and map the number to one of the five risk labels. Unfortunately, this simple-sounding method doesn’t tell investors anything about how much they could lose or how long they should hold a fund to minimize the chance of loss.
Nine years ago, in my first column for Investment Executive (an industry publication), I urged regulators to adopt a simpler and more practical forward-looking approach that communicated to investors that stocks had lost half of their value in past bear markets and that this would eventually repeat in the future. By contract, Fund Facts typically rated stock funds as “medium risk” back then (as now).
 Sixteen months following this column, stock markets around the world had declined by 40% to 60%. Investors who were told that stocks would occasionally be cut in half were better prepared for the Financial Crisis compared to those relying on labels like “medium risk”. That was the ultimate test of Fund Facts’ risk rating and it failed miserably in my view.
The next test is how ratings have changed. There is every reason to believe that bear markets will continue to occur in the future. So the risk of bear markets – and the associated losses – does not diminish over time. On the contrary, as stock and bond prices keep rising one could argue that risk increases. And yet investment fund risk ratings (found on Fund Facts) have overwhelmingly been reduced.
Tracking Mutual Fund and ETF Risk Ratings
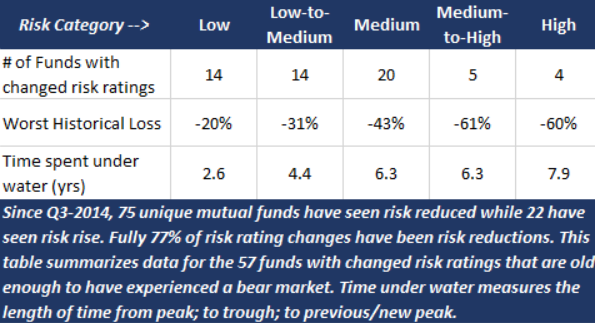
Over the past two years, I tracked risk rating changes for nearly 100 unique mutual funds and ETFs. 77% of those funds saw risk ratings reduced despite the fact that we’re nearly 8 years into one of the longest bull markets in history for stocks and bonds.
Of the funds tracked, 57 have enough history to have experienced at least one bear market. The 14 funds sporting their new “low risk” ratings lost an average of 20% in the last bear market – spending more than 2.5 years under water. 20 funds of those funds now fall into the “medium risk” bucket. Those funds lost 43% on average in the last bear market, spending more than 6 years under water.
I’d wager that few investors would equate low and medium risk with those downside risk numbers. The table below summarizes data on all 57 funds I tracked that are old enough to have bear market data:
Specific Examples
Take Manulife Global Real Estate as an example of how this risk rating method is failing investors. On August 1, 2014 its risk was reduced from “high” to “medium-to-high”. Less than a year later, this fund’s risk rating was cut again to “medium”. What had changed in less than a year to see its risk rating move from “high” to “medium”? When times are good and prices are rising, volatility (or standard deviation) tends to fall. As SD falls, its risk rating – according to the current and new rating method – has a good chance of falling. Yet this fund lost 42% in the last bear market and spent 3 years recovering.
MD American Growth is another, more striking example. This past May, its risk rating was dropped from “medium-to-high” to “medium”. From August 2000 through March 2003 this fund lost 55% of its value. It rose less than 20% in the subsequent four years – still far from recovery. That’s when the Financial Crisis started – a lengthy decline that clipped another 41% off of its value.
That’s a peak-to-bottom loss of 68%. And as of November 30, 2016 it’s still a few percentage points below its peak in August 2000 – more than 16 years ago. The CSA’s new risk rating method would keep this firmly in the medium risk bucket, despite losing more than 2/3rds of its value and only now inching back toward its peak from more than 16 years ago.
Final Thoughts
As professionals working directly with – and held accountable to – our clients, we take the measurement and communication of risk very seriously. While I don’t doubt regulators’ intent, this risk rating method makes no sense to me. More importantly, I highly doubt that this will make much sense to the very people this rule was designed to protect and inform.
HighView is an experienced investment counselling firm for affluent Canadian families and foundations. Schedule a complimentary discovery session to see if we’re the right team for you.
You may also be interested in: