
In this weekend’s Report on Business, Rob Carrick nicely captured my mixed feelings about balanced funds. As I noted in a recent Wealth Steward post, it’s critical to keep an eye on fees when choosing your bond exposure. Yet, the vast majority of balanced funds – which hold significant stakes in bonds – sport management expense ratios that are on par with stock funds. The reasoning goes something like this: the firm charges a management fee that blends its fees for stock and bond management, plus something extra to manage the asset mix.
As a result, fees average about 2% for all balanced funds. The table below, however, shows balanced fund average MERs (asset-weighted) broken out by type of balanced fund, calculated in late 2009 using data from Morningstar Canada.
| Fund Class | CIFSC Cat | MER |
| Balanced | 2010Target | 1.74% |
| Balanced | CdnNtrlBal | 1.82% |
| Balanced | CdnFxInBal | 1.83% |
| Balanced | GlbFIBal | 1.95% |
| Balanced | CdnEqBal | 2.05% |
| Balanced | GlbNtrlBal | 2.12% |
| Balanced | 2015Target | 2.26% |
| Balanced | TactBal | 2.28% |
| Balanced | 2020+Tgt | 2.31% |
| Balanced | GlbEqBal | 2.36% |
| All Balanced Funds | 2.02% | |
With Canadian bond yields hovering around 2.8%, the challenge becomes painfully obvious for balanced funds. Accordingly, the larger the bond component, the less the potential to add value and the more important the MER should be in the selection process. In Rob Carrick’s article I provided three balanced fund suggestions for investors dealing with an advisor and a few others for do-it-yourself investors.
Early in my career, I didn’t recommend balanced funds because of the fees. But when I became aware of the investor behavioural benefits, I started recommending balanced funds. Since investors only see the smoothed return path of the ‘balanced bundle’, investors are less prone to panic and greed – leading to longer holding periods which, in turn, leads to higher investor returns.
In other words, investors actually realize higher returns in balanced funds compared to what they earn investing in individual stock and bond funds. To clarify, it’s important to distinguish between performance published by mutual funds and the returns that investors actually realize over time.
See the chart below which I prepared for a conference presentation two years ago.
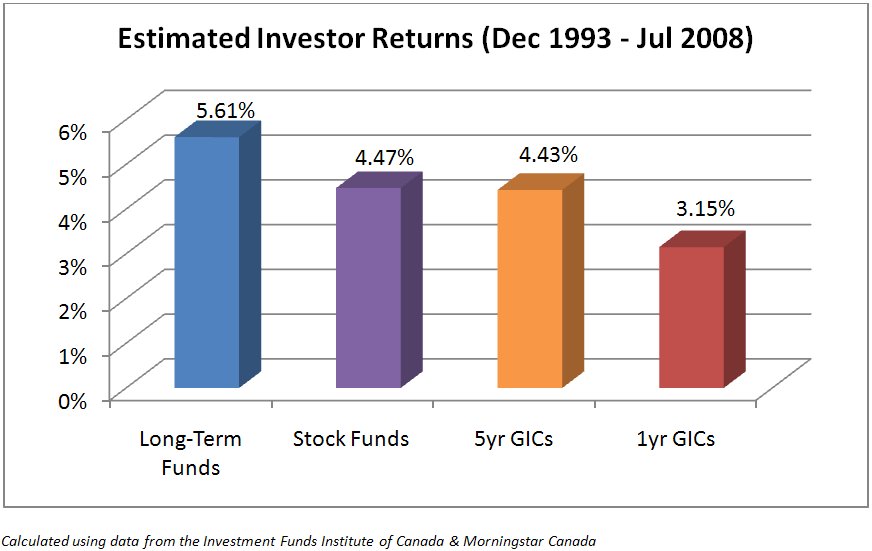
The chart shows that investors in IFIC-reporting mutual funds from December 31, 1993 through July 31, 2008 experienced lower returns in stock funds compared to their returns in other long-term (i.e. non-money-market) funds. There are many reasons for these disappointing results, which I’ll explore in an upcoming article.
See also: Volatility measures behavioural risk