
The final month of 2018 brought some wild swings to global equity markets, leading to headlines such as “Markets plunge with Dow posting worst Christmas Eve session on record”, followed one (trading) day later by “Dow soars more than 1,050 points, its biggest point gain in history”.
With these large day-to-day (and intra-day) moves in equity markets, we have heard and read numerous comments about equities becoming more volatile due to the proliferation of computer-driven program trading, hedge funds, index funds, and/or ETFs. So we decided to take a look at the facts. Instead of looking at standard deviation (the traditional statistical measure of volatility), we chose look at the daily movements of the S&P 500 Index (price only) over a very long period of time to determine if in fact large swings have become more prevalent.
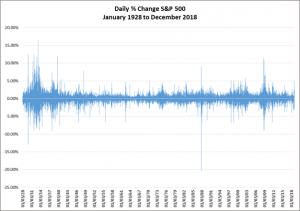
The first chart below shows the daily percent change in the S&P 500 from the beginning of 1928 to December 31, 2018. It’s difficult to garner much insight from this chart other than during extreme events (e.g. the late 1920s, early 2000s, and 08/09) the size of the daily moves seems to increase (no surprise here).
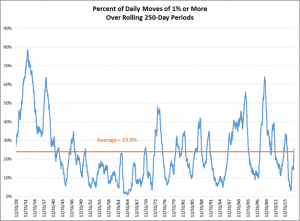
We then looked at rolling 1-year periods (1 year defined as 250 trading days) and plotted the percent of time the market moved up or down by 1%, 3%, or 5% (or greater). For example, in the first chart below the S&P 500 moved up or down in a single day by 1% or more (on average) 23.9% of the time (over rolling 250-day periods) from 1928 to 2018 (orange line in the chart below). At its peak in 1932 nearly 80% of the trading days saw the S&P 500 Index move up or down by 1% or more.
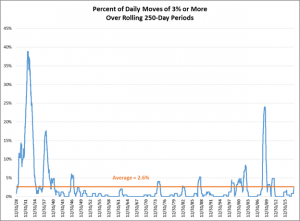
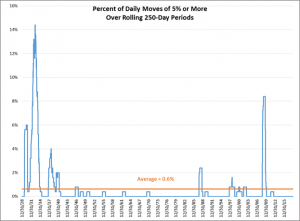
The next two charts show that moves of 3% (or more) and 5% (or more) in a single day are relatively infrequent, but not unprecedented. And large market swings tend to happen more frequently during times of significant market stress, such as the late 1920s and early 1930s, the early 2000s (tech wreck), and the 2008/2009 (financial crisis). What we don’t see is a pattern of increasingly larger day-to-day movements or increasing frequency of large day-to-day movements over this extended period of time.
Are ETFs and other things such as computer-driven program trading exacerbating market movements? Perhaps they are in some less liquid markets, however for the S&P 500 Index the facts do not appear to support this often-quoted belief.
Large market swings understandably can rattle one’s nerves, however all investors are would be wise to ignore the alarmist headlines that these moves generate and remember that this type of activity is quite normal and has been occurring for decades.
HighView is an experienced portfolio management firm for affluent Canadian families and foundations. We would be happy to discuss our goals-based investment approach with you and your professional advisors.
You may also be interested in:
- Mitigating Volatility to Create Sustainable Family Wealth
- Why Portfolio Monitoring Creates Sustainable Wealth
- Cannabis Stocks: Worth the Hype or Likely to Send Your Wealth Up in Smoke?