
There is a lot to like about dividend-paying stocks. Dividends generally follow earnings, and are cold hard evidence of earnings’ existence. In Canada, this infatuation with dividend-payers is compounded by our love of bank and utility stocks, and favourable tax treatment of dividends paid by Canadian companies. Many Canadians view dividend-paying stocks as an investment cure-all – e.g., replacements for low-yielding bonds, and protection from a bear market or rising interest rates. And while they can sometimes deliver, history shows that the expected protection is far from certain.
What Have You Done for Me Lately?
The recent infatuation with some dividend-paying equities is fueled by their strong performance during 2018’s late-year market decline. Dividend-paying stocks as a group didn’t fare much better (-9%) than the broader group of Canadian stocks (-11%) during last year’s final quarter, but real estate investment trusts (-3%) and utilities (-1%) held up very well. An examination of past performance, however, can add some context to the potential for dividend stocks to offer the desired protection in the future.
Bear Market Protection
I examined the performance of the S&P/TSX Capped Composite Total Return Index (a measure of a broad cross section of Canadian stocks) and the S&P/TSX High Dividend Composite Total Return Index (which tracks 50-75 high yield domestic stocks) through the last few bear markets. Since the High Dividend Index only goes back to 1998 – which includes only three bear markets – I included other significant declines that didn’t quite hit bear market territory. What I found – not surprisingly – was no special bear market protection. Table I below summarizes performance and recovery during several market declines.
Table I – Performance during bear markets and other market decline
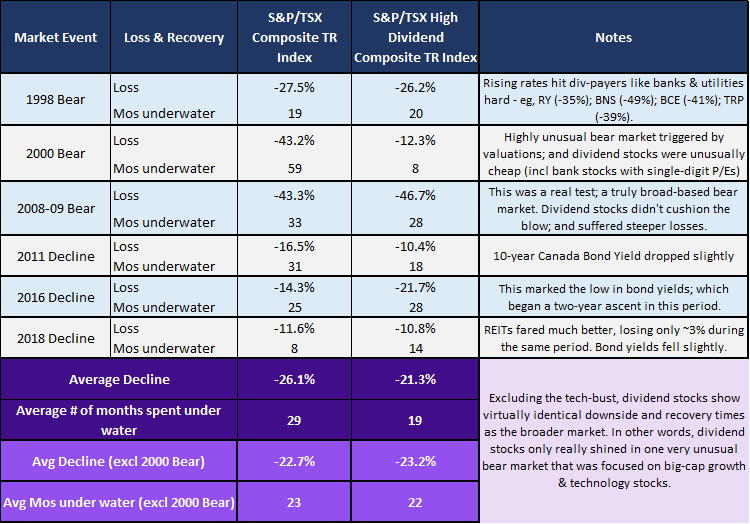
Dividend stock proponents will point to materially smaller losses (-21.3% on average for High Dividend Index vs. -26.1% for the broader market) historically with less time spent in loss territory (19 months vs. 29). But exclude the post-2000 bear market and you’ll see that dividend paying stocks sported virtually identical loss and recovery stats as the broader group of domestic stocks.
It may be unfair to exclude the 2000 bear market; one of the worst in history. But I exclude it because of its unique characteristics. Unlike most bear markets, that one was not broad based. Dividend stocks were very cheap after sitting on the sidelines during the market’s tech-focused euphoric rise (1998-2000). The market then became intolerant of stocks trading at 200x earnings. As a result, prices sank and investors flocked to previously ignored dividend-paying stocks – which rose in price while the broader market fell. But so did shares of oil companies, manufacturers, and smaller companies in general, and nobody’s expecting those types of stocks to offer any sort of protection in the next bear.
The Tailwind of Falling Interest Rates
I also examined the performance of these two groups of stocks in periods of rising and falling interest rates. I used changes in the yield on the benchmark 10-year Government of Canada bond to gauge interest rate changes. Table II below summarizes performance over the last 21.5 years, isolating returns of each group of stocks during months of rising and falling bond yields.
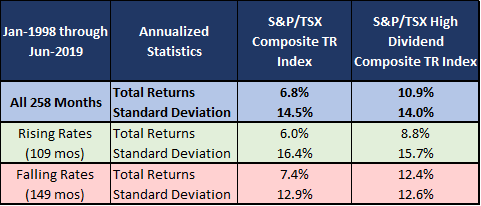
As expected, falling interest rates have been a tailwind for all stock prices. The S&P/TSX Composite saw a relatively small spread between periods of rising and falling rates – 1.4% per year. But dividend stocks showed greater sensitivity to rate changes, with returns in months of declining rates exceeding returns in rising rate months by 3.6% per year. Still, dividend stocks performed well in periods of rising rates, which aligns with O’Shaughnessy Asset Management’s evaluation of U.S. and global high yield stocks.
Structure Portfolios for Multiple Outcomes
The best protection is to structure a portfolio that is designed to meet individual goals. Financial markets are inherently uncertain. Investing in assets that will make you money but are affected by different factors and economic outcomes will minimize the impact of the next bear market. And if you’re armed with a disciplined and well-designed rebalancing policy, you’ll be as well positioned as you can be the next time financial markets throw investors a curve ball.
We encourage you to review the full 21 Questions Interactive Resource Guide and Download our Summary PDF to help you assess the right fit with a financial advisor.
HighView is an experienced fiduciary portfolio management firm committed to investor transparency. We would be happy to discuss our goals-based investment approach with you and your professional advisors.
Watch our videos about a variety of asset management topics.
You may also be interested in: