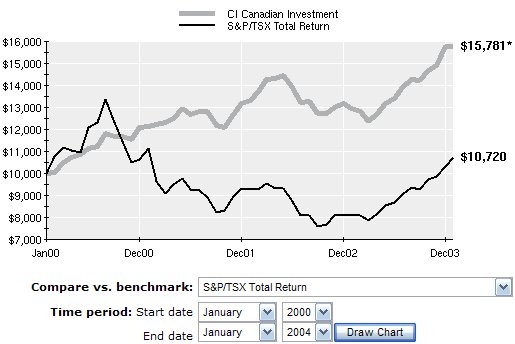
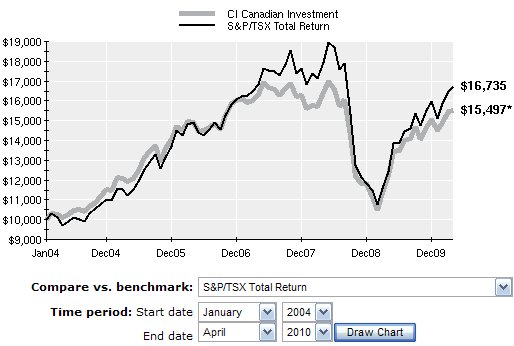
The fund again resumed its tight correlation to the index starting in 2004 (until so far this year). The lesson: don’t rely on the trailing three or five year correlation or r2 to tell you what will happen in the future.
4. Use correlation as a screen, then form an understanding of a fund. If you want to find index-huggers, you can certainly use r2 or correlation as a screen but dig further by looking at fund holdings, risk and return. A concentrated portfolio, with say 20-30 Canadian stocks, is likely to be pretty active. Or if a fund has tracked index performance but with significantly less risk or volatility, that is a form of value-added and indicates an active approach.
If you subscribe to a monthly update software like FundProfiler, PalTRAK or Globe HySales, the information should be readily available but there are some free sources. By registering for a user ID (should be free) you can use the FundLibrary’s fund filter to screen by r2. Globeinvestor’s fund profiles also provide the information to calculate correlation for any fund. Let’s use CI Canadian Investment Fund as an example. Look it up at Globeinvestor and find the the lines labelled 3 year risk and 3 year beta at the bottom of the Returns table. Those two figures can be used to calculate the 3 year correlation coefficient for the fund, as follows:
3 year beta (Fund) x [ 3 year risk (Index) / 3 year risk (Fund) ]
Proponents of active management should search for managers that don’t shadow the index. Just make sure you use the correlation or r2 statistic with full awareness of its limitations. Otherwise, you could miss some truly skilled money managers.